
 Norsk
NorskRadar animation
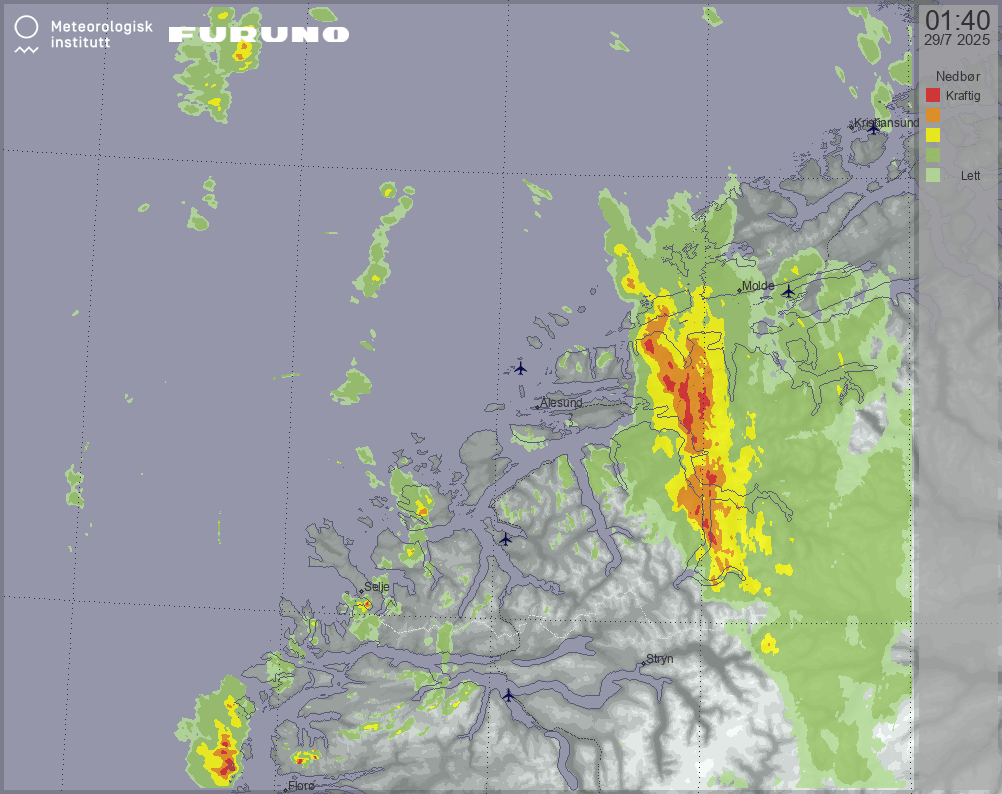
Multi radar animation
Precipitation
Update cycle: 5 min, 45 min history
The animation displays areas where precipitation is currently anticipated and is based on reflectivity data along with the Marshall-Palmer method. By analyzing the animation, it becomes possible to predict the movement and intensity of precipitation over time. This composite consist of radar data from MET Norway`s governmental radars located on Stadt and Rissa in combination with Furuno radar in Ålesund.Light precipitation may or may not reach ground.
The color palette levels from "Lett nedbør" up to "Kraftig nedbør" corresponds to approximately 0.03, 0.1, 1.0, 2.5 and 5.0 mm/hour.Light precipitation may or may not reach ground.