English
Analytics Software flexibility
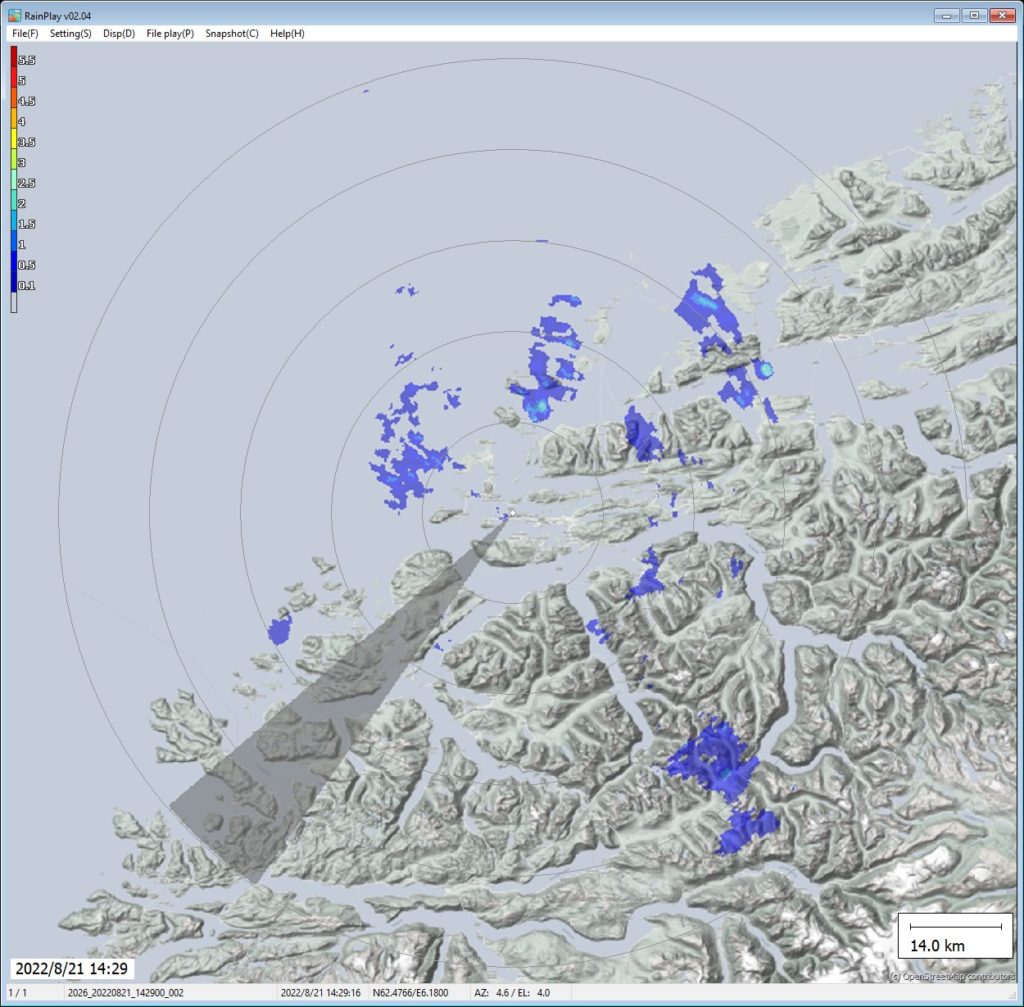
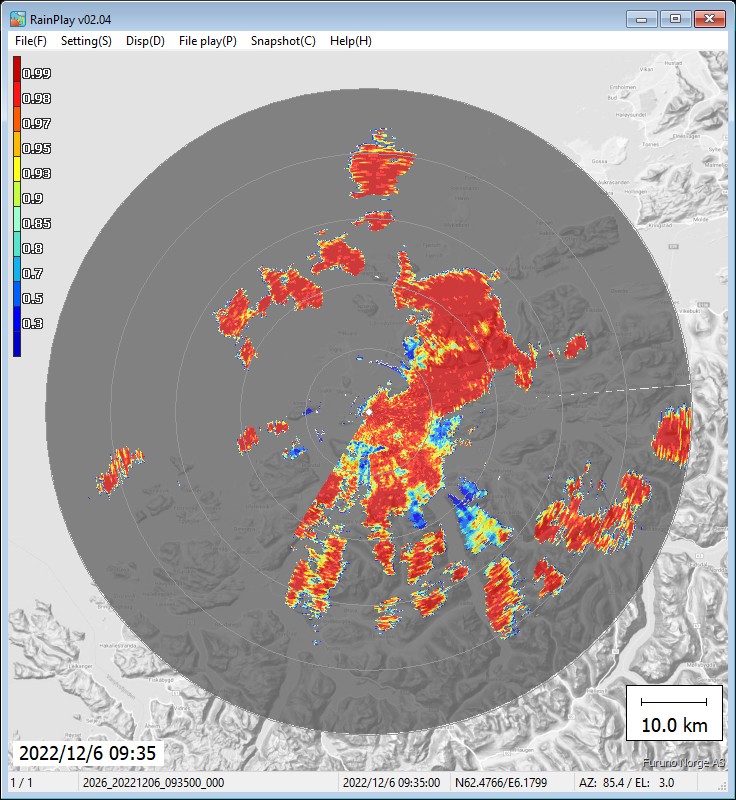
All Furuno weather radars are delivered with Rainmap software for stand-alone operation. The software is used for radar setup, calibration and as a viewer.
For more complex operation our radar can be used in a 3rd party software solution.
Furuno weather radar supports the following file formats:
- Binary
- CSV
- JPEG
- CF/Radial
- Opera Odim HDF5
- NEXRAD Level 2
WR-110 : Single Polarization
The single polarization Furuno WR-110 gives you the following meteorological products.
- Reflectivity factor Zh (dBZ)
- Rainfall intensity Rain (mm/h)
- Doppler velocity V (m/s)
- Doppler velocity width W (m/s)
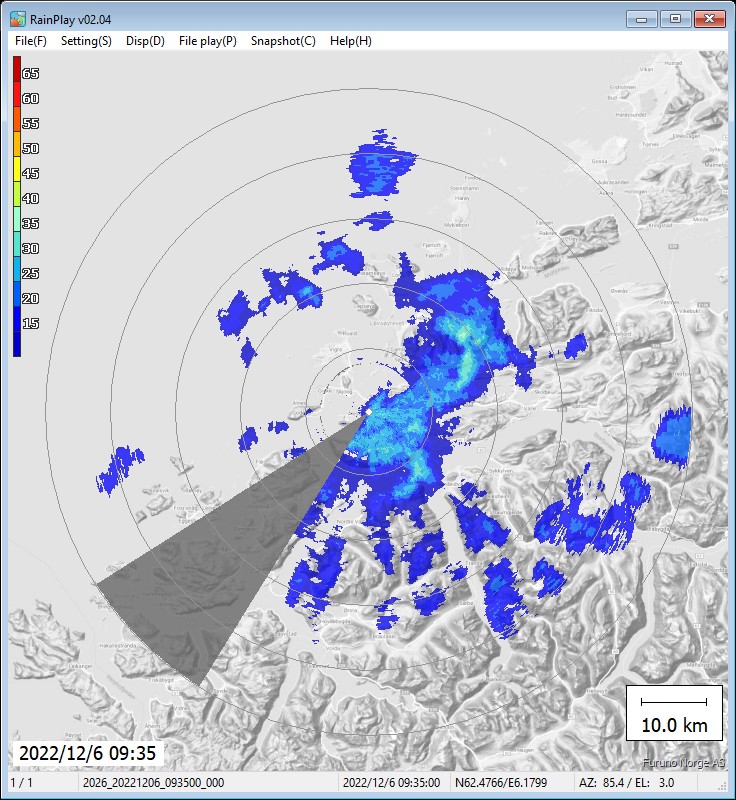
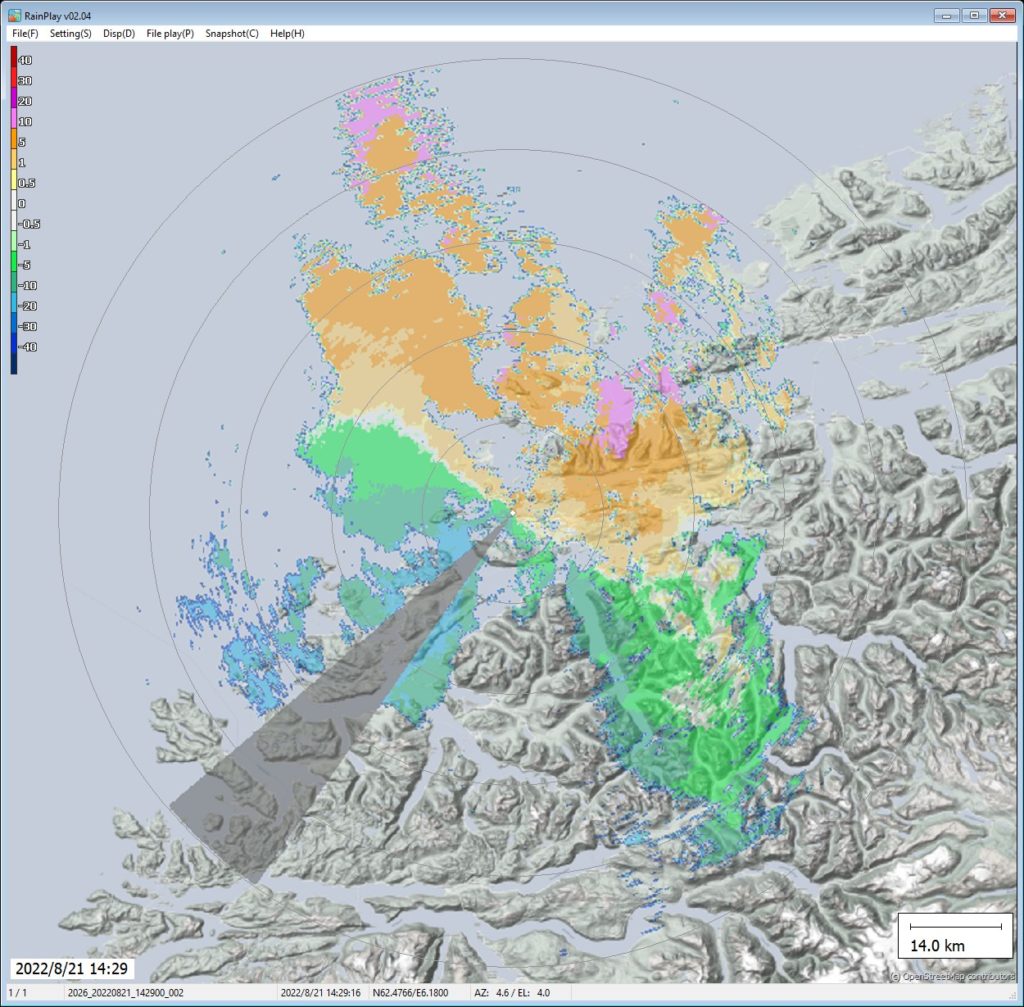
Reflectivity factor Zh (dBZ)
The colors represent the strength of returned energy to the radar expressed in values of decibels (dBZ).
As dBZ values increase so does the intensity of the rainfall. Value of 20 dBZ is typically the point at which light rain begins.
While WR110 only detect in horizontal, the WR2120 can detect both in horizontal and vertical plane for more accurate measurements.
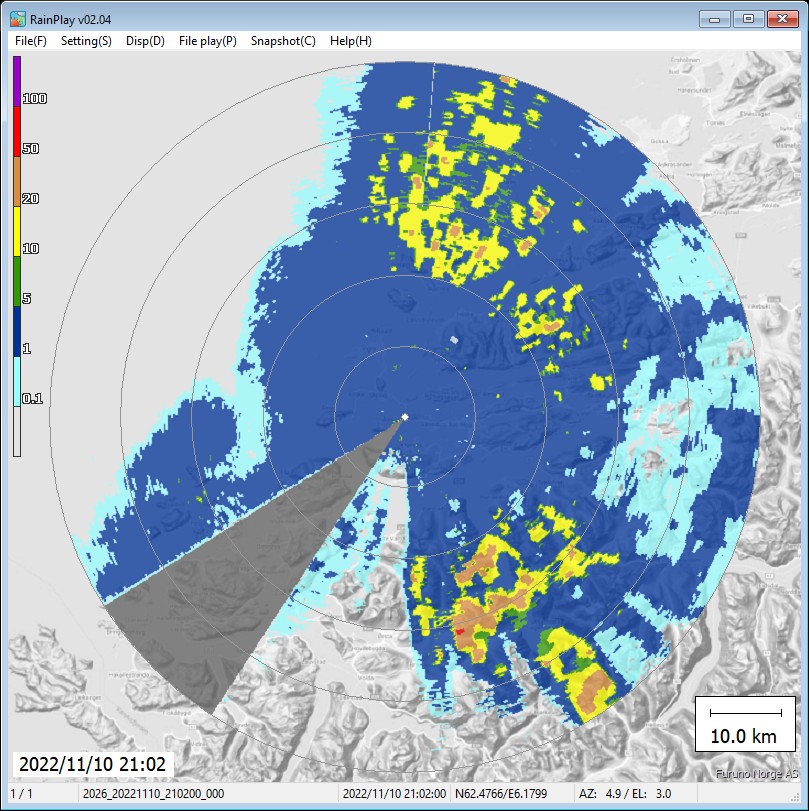
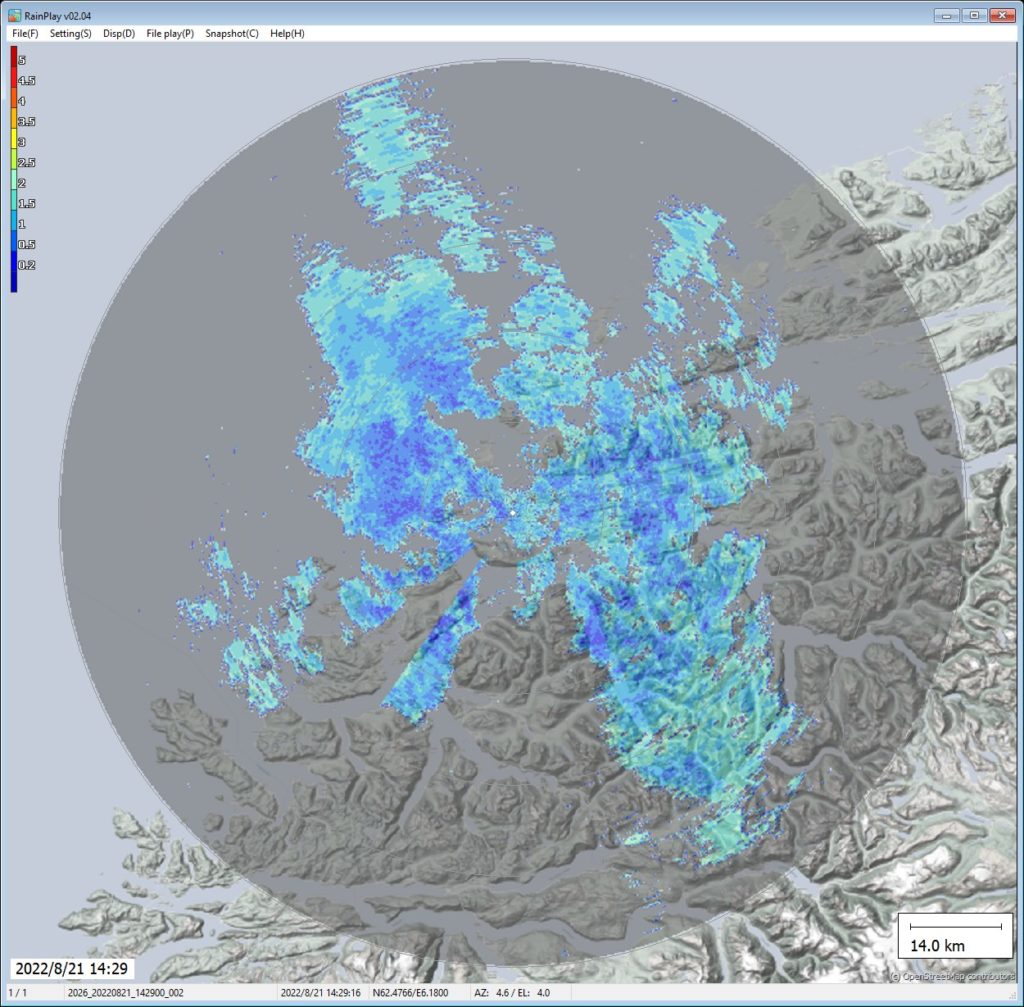
Rainfall intensity R (mm/h)
The WR110 and WR2110 can depict rainfall intensity, but only WR2110 can provide particle classification between rain, snow, hail, fire plum (debris) etc.
Light blue represents light drizzle, while dark purple is used to depict very heavy rain (possibly containing hailstones).
Widespread rain
Radar echoes from widespread rain are usually extensive and fairly uniform in intensity, with ill-defined edges.
Cumulus clouds
Radar echoes from the precipitation within the cumulus (tall bubbly clouds) appear as sharp-edged cells scattered around the radar display. The estimated rainfall intensity can be medium to heavy owing to the high rainfall rates from such clouds.
Heavy Precipitation from thunderstorms
Radar echoes from the rain and hail produced in thunderstorms are very sharp-edged cells with intense cores indicating heavy rainfall. Thunderstorm precipitation cells can appear as isolated cells or in clusters or lines.
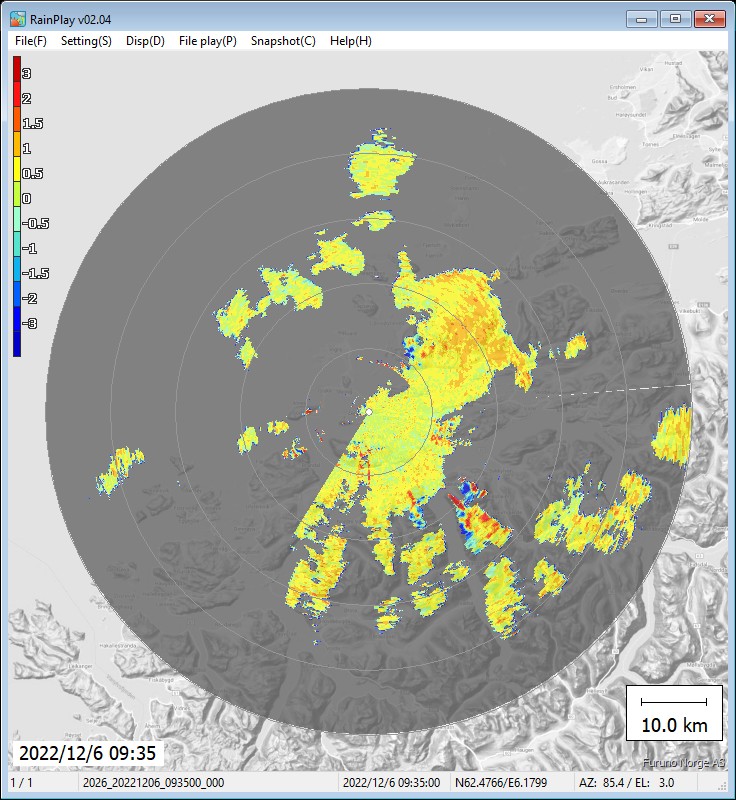
Doppler velocity V (m/s)
A doppler radar product that measures wind speed and direction.
The wind is measured relative to the radar, so in this case:green and blue winds = towards the radar, and pink and orange winds = away from the radar.
The brighter the colors, the faster the winds.
This product will identify if a front is approaching, rotation in wind and wind share, which could be dangerous to aviation.
Doppler velocity width W (m/s)
Doppler Velocity Width - is the standard deviation of V and is spread by disturbance, noise, etc. and normally used to reject noise from V.
WR-2120 : Dual Polarization
- Reflectivity factor Zh (dBZ)
- Rainfall intensity Rain (mm/h)
- Doppler velocity V (m/s)
- Doppler velocity width W (m/s)
- Cross polarization difference phase φdp (deg)
- Specific differential phase Kdp (deg/km)
- Correlation coefficient between H/V pol ρHV
- Horizontal and Vertical differential reflectivity ZDR
Differential phase shift (cross polarization) φdp (deg)
Differential Phase Shift (Φdp) is a measure of the difference in 2-way attenuation for the horizontal and vertical pulses in a pulse volume. As vertical and horizontal radar pulses pass through a particular target, the two pulses attenuate, or slow down, causing each pulse's phase to change. Φdp shows the difference in phase shift between the horizontal pulse and the vertical pulse.This provides information about the shape and concentration of radar targets.
Specific differential phase Kdp (deg/km)
Difference between horizontal and vertical propagated pulses, by calculating each range component (bin) of the φdp slope data. Kdp determines where, along propagation path the differential phase (φdp) changes are occurring.
Mainly used for heavy rain observation and not dependent on transmit / receive power.
- High concentrations of small raindrops yield a higher Kdp than lower concentrations of large raindrops.
- Heavy rain area has a high Kdp.
- Hail, snow and ice crystals lack specific orientations yielding near zero Kdp.
Typical KDP values:
- Hail: Near 0 (except for melting layer)
- Snow: -1 to +0.5
- Rain: 0 to +5 (high number indicates large droplets and/or increased drop concentration)
- Non-meteorological echoes: not shown
Correlation coefficient can be used to help distinguish between meteorological and non-meteorological targets, find the melting layer, identify giant hail, identify tornadic debris, and check the quality of other dual-pol products.
Used for detecting:
- Large hail
- Tornadic Debris
- Rain vs Snow
- Melting Layer
- Irregular hydro shapes
- Measure of how similary the horisontally and vertically polarized pulses are behaving in a pulse volume
- Great at disctiminating non vs met echoes
The freezing lineThe point at which precipitation freezes into ice or snow. Everything above this line is ice and snow, and everything below it is typically rain.
Bright bandTransition zone between the snow and rain. snow is melting into rain, it becomes a mixed form of precipitation which reflects radar beams better.
Horizontal and Vertical Differential factor ZDR (dB)
Difference between horizontal and vertical reflectivity factors = Drop Shape.
This parameter determines reflectivity difference and is used for classifications. Positive value indicates target is larger horizontally than vertically, negative value indicates target is larger vertically than horizontally.
Zdr can be used to help identify hail shafts, detect updrafts, determ raindrop size, and identify aggregation of dry snow.
Used for detecting:
- Hail
- Rain vs Snow
- Melting layer
- Updraft
- Different types of frozen precipitation