English
Installation site
Furuno may assist in site survey at the potential sites to make sure that you are getting the most out of your weather radar, and for a quick and easy installation.
System configuration
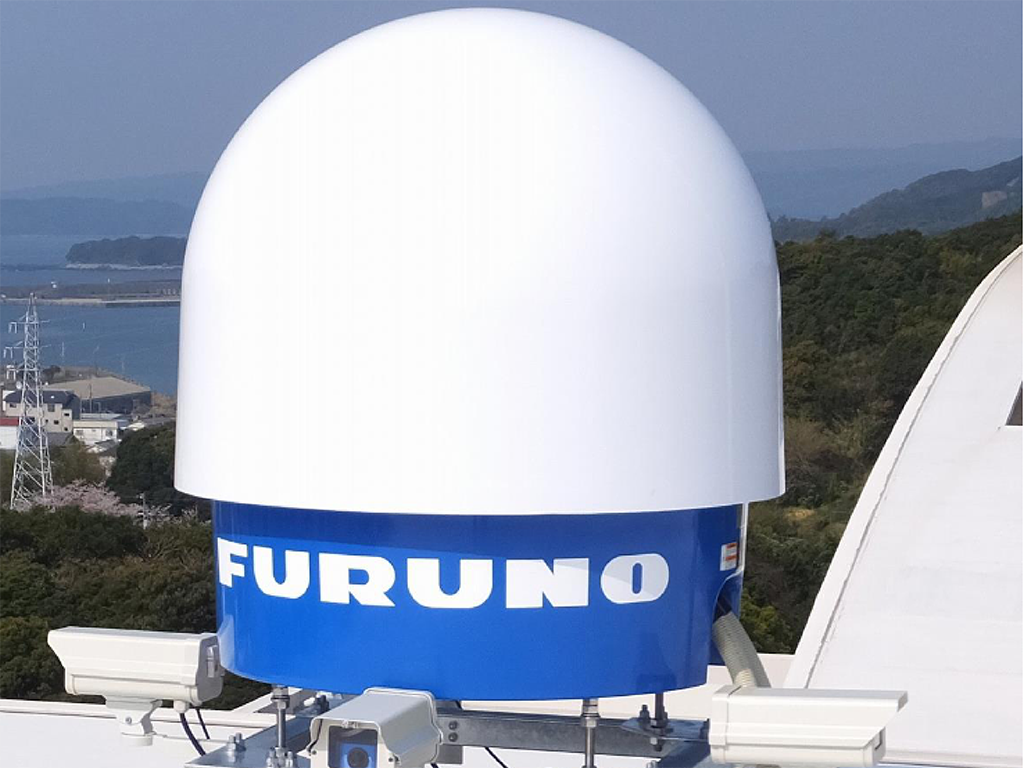
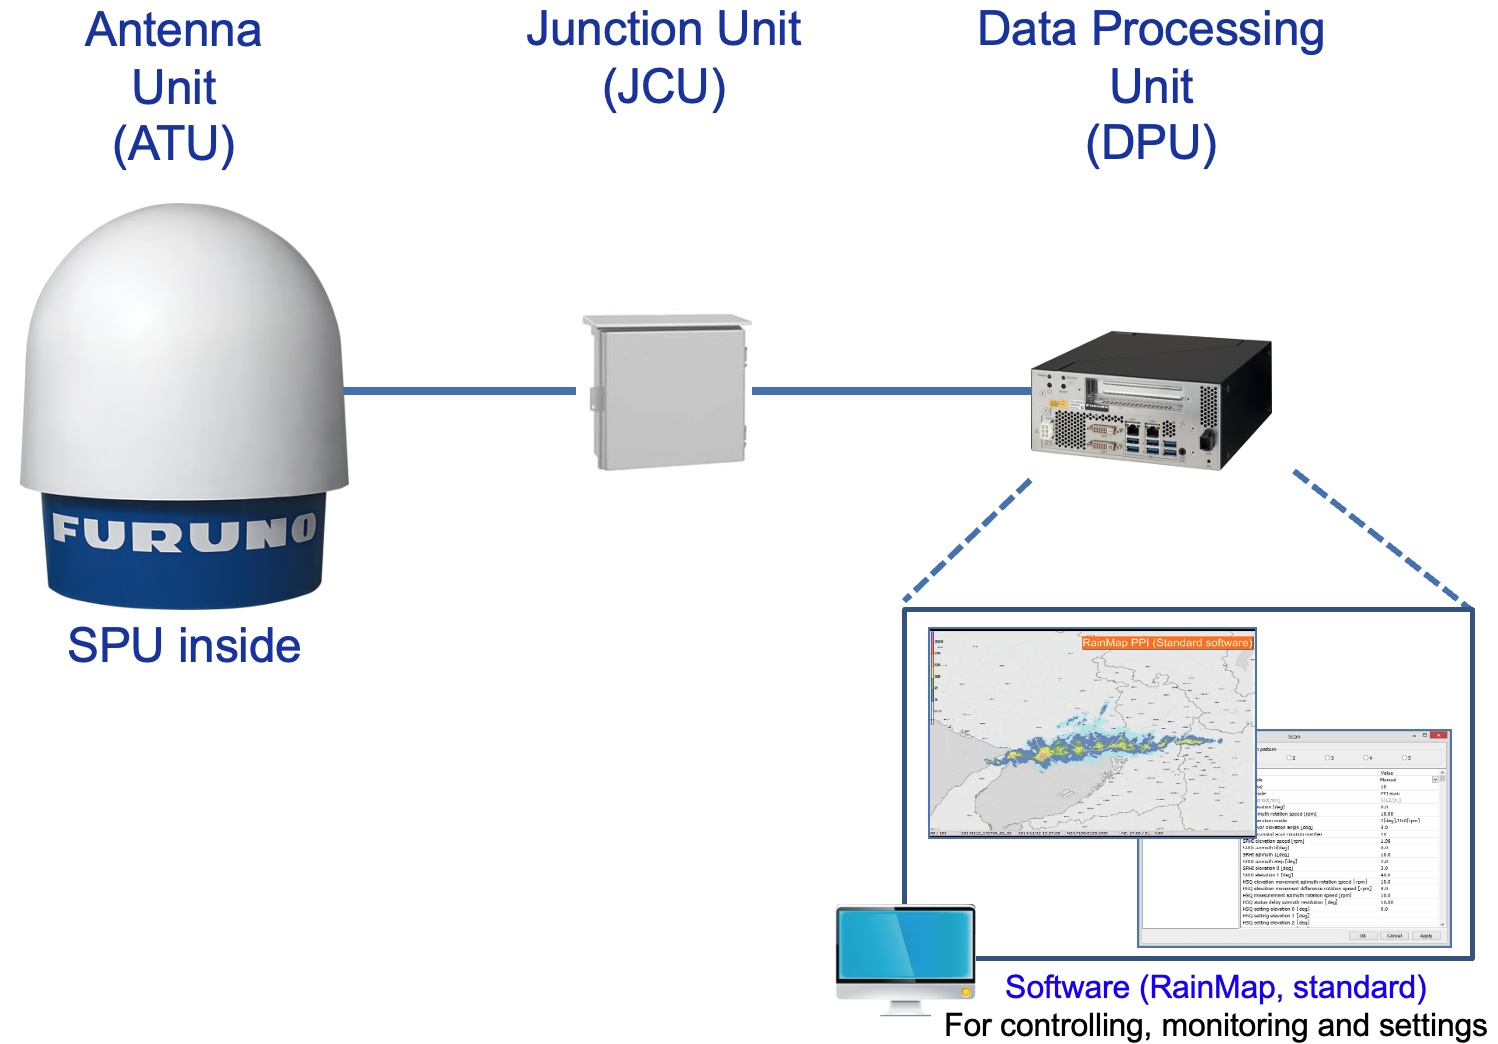
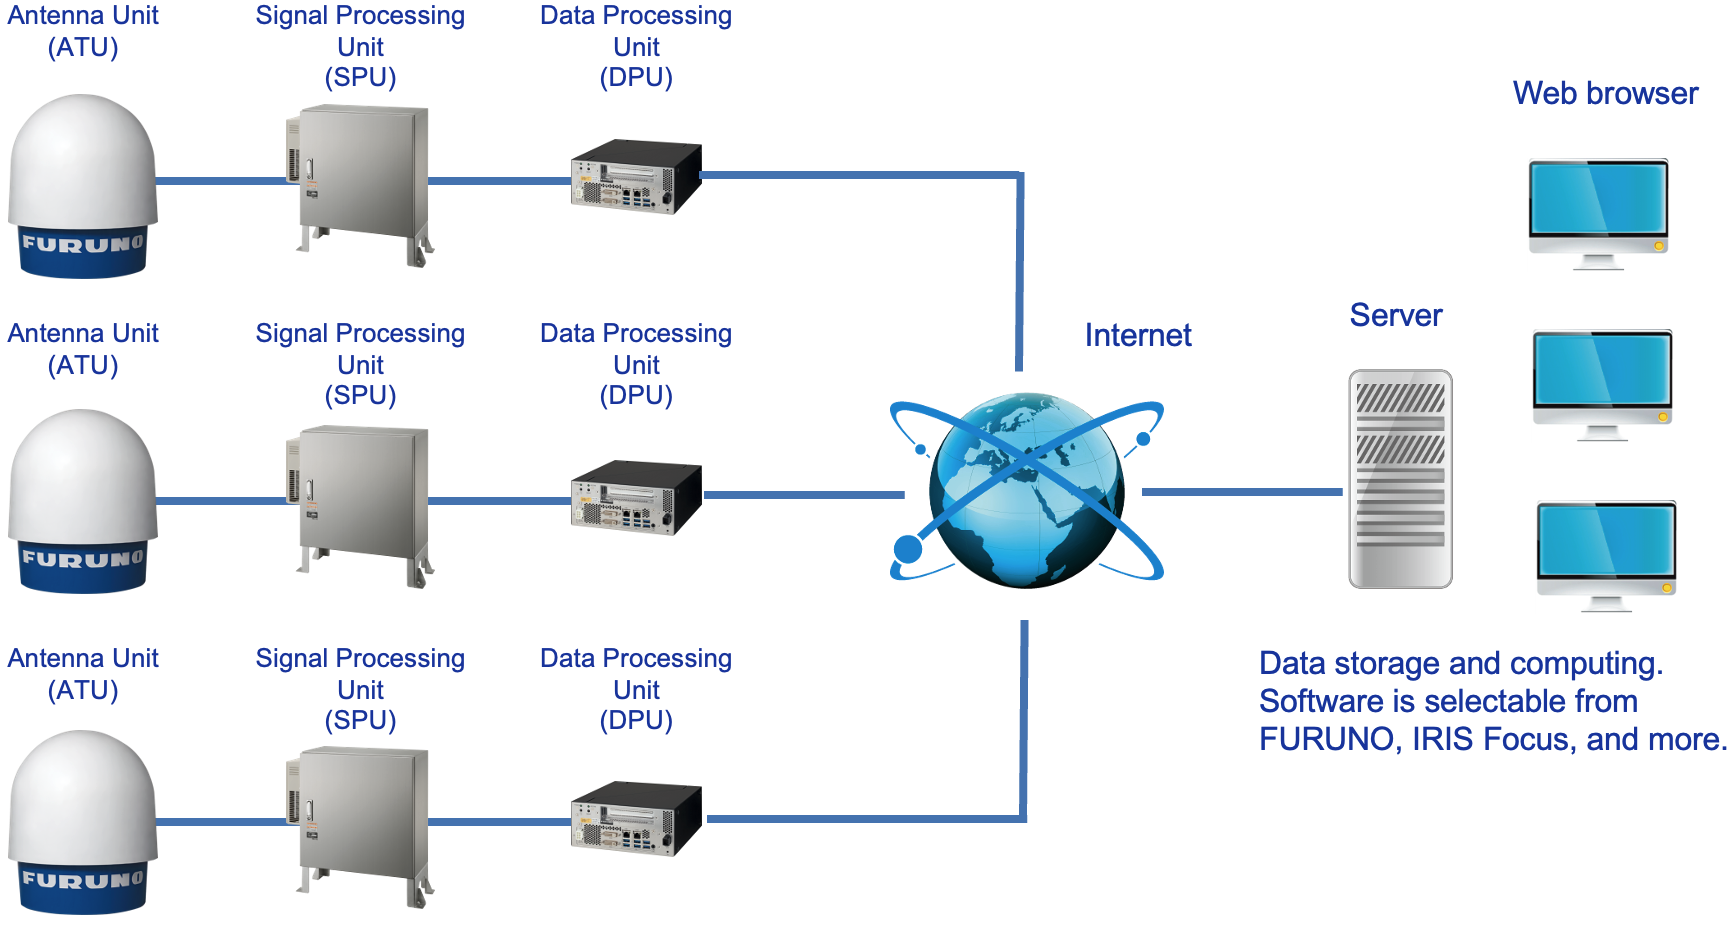
The Furuno weather radar system consists of three independent parts:A dome which are housing the antenna, the signal processing unit or a junction box (WR110), and the processor which converts the received signals into rainfall images. The equipment must be furnished with stable 230VAC or 110 VAC (option). Consequently, an internet connection must be available at the installation site. This allows for remote viewing, operation and adjustments of the radar settings. Collected images can be displayed in the included software - RainMap, or used in a 3rd party analytic software.
WR-110 Standard configuration
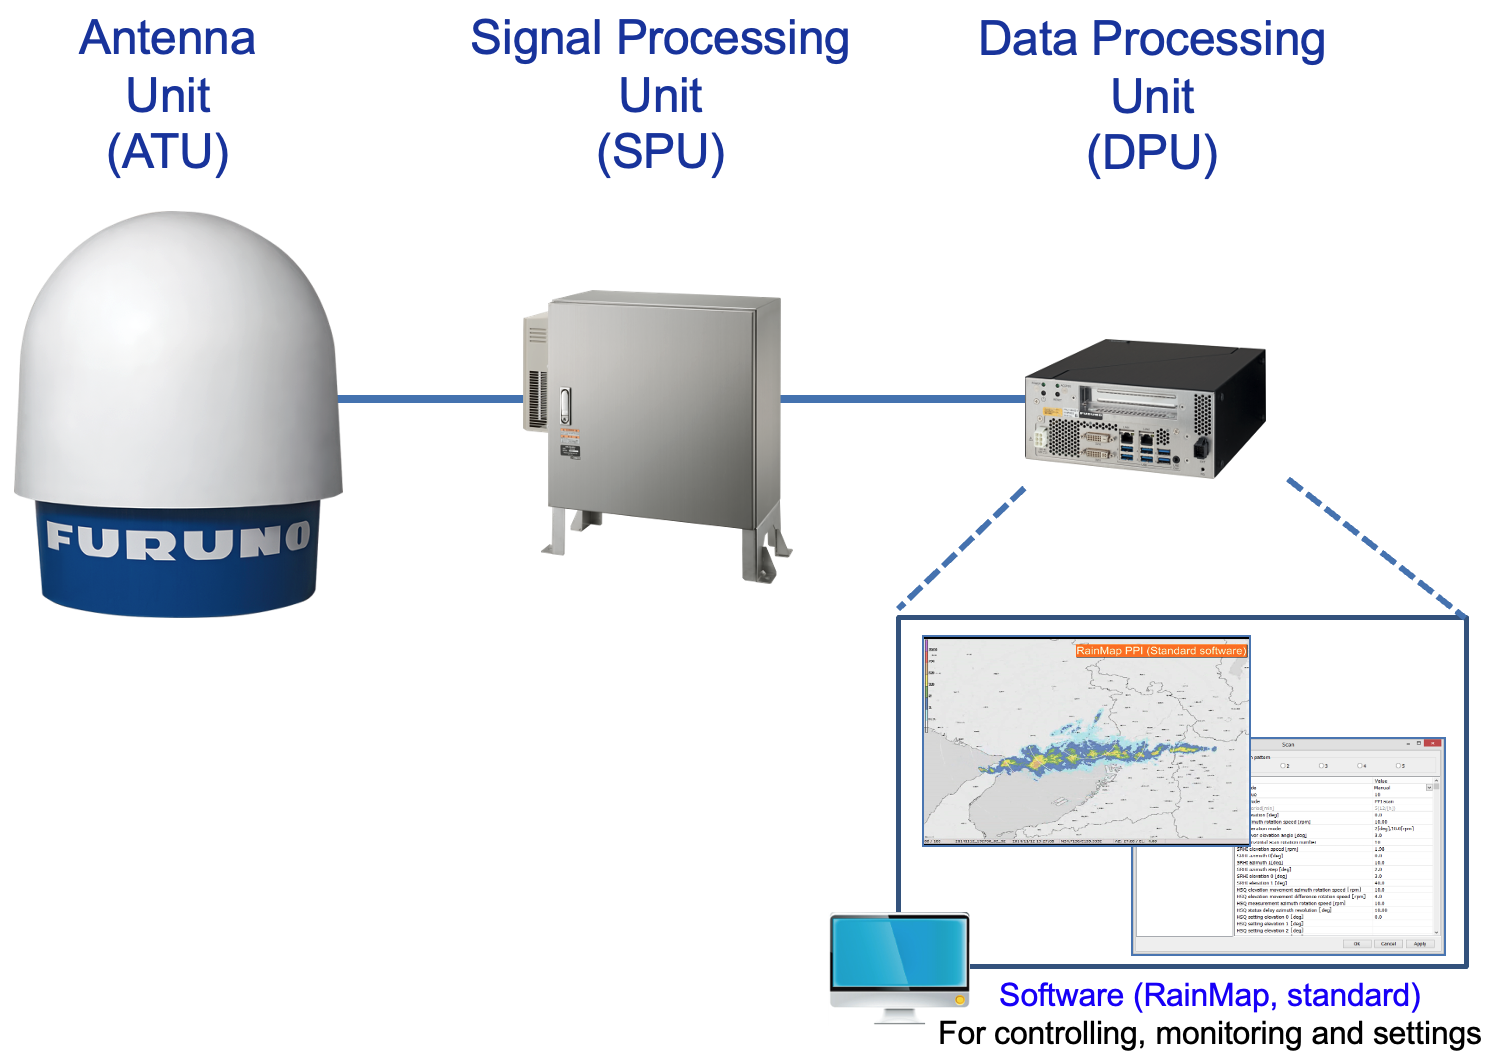
WR-2120 Standard configuration
The dual polarimetric radar WR2120, requires more processing power than the WR110. All signal processing is placed in a unit which is built to last in though weather conditions.
multi-radar configuration
Multiple-radar Configurations
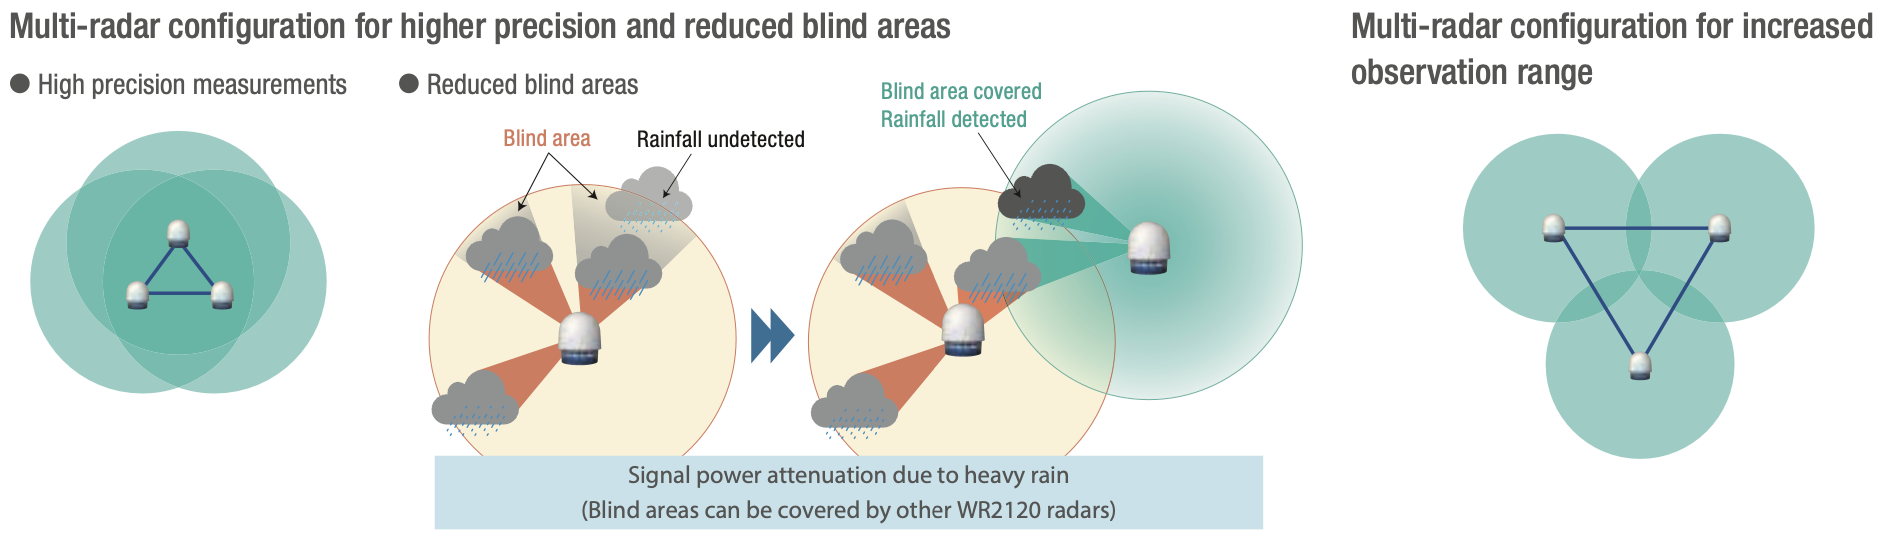
In most cases you will add more benefits by combining two or more weather radars in a network. Placement of these radars are vital factors if you want to increase the observation range or to achieve high precision measurements for research or special needs.
Multiple-radar demonstration
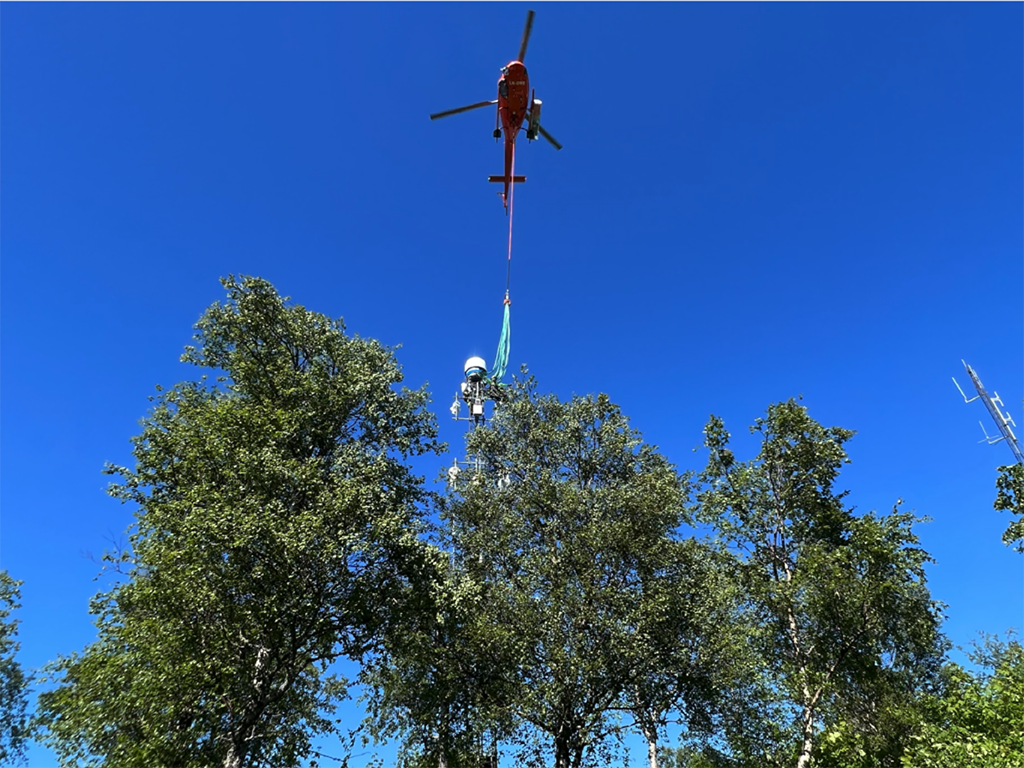
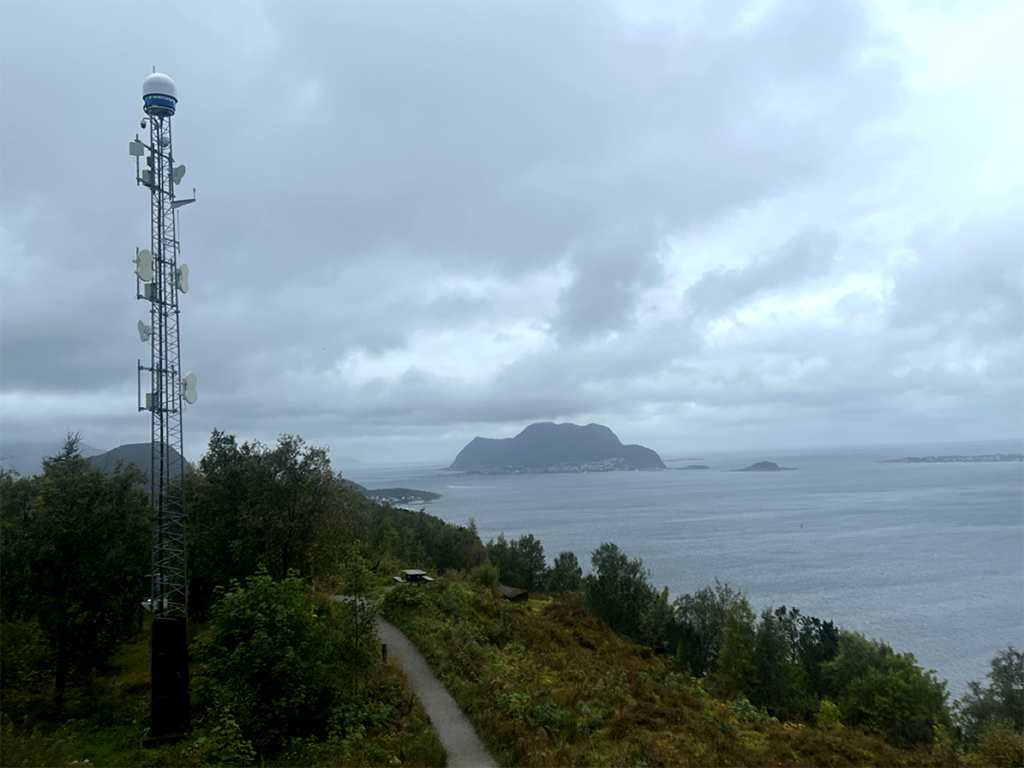
Furuno WR2120 are located on Aksla mountain inn Aalesund Municipality, and are providing high resolution weather data from its surroundings. The area around Aalesund are high mountains and breathtaking fjords, and is of that reason challenging to cover by itself. For this demonstration, the Furuno WR2120 are in network with two of Norwegian Meteorological Institute`s radars. This gives not only an increased range, but the radars are helping each other to cover "blind spots" and of course gives an higher precipitation accuracy closer to radars at lower levels.
Scan alternatives
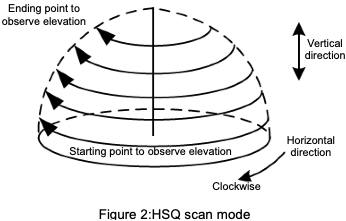
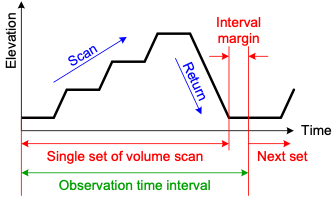
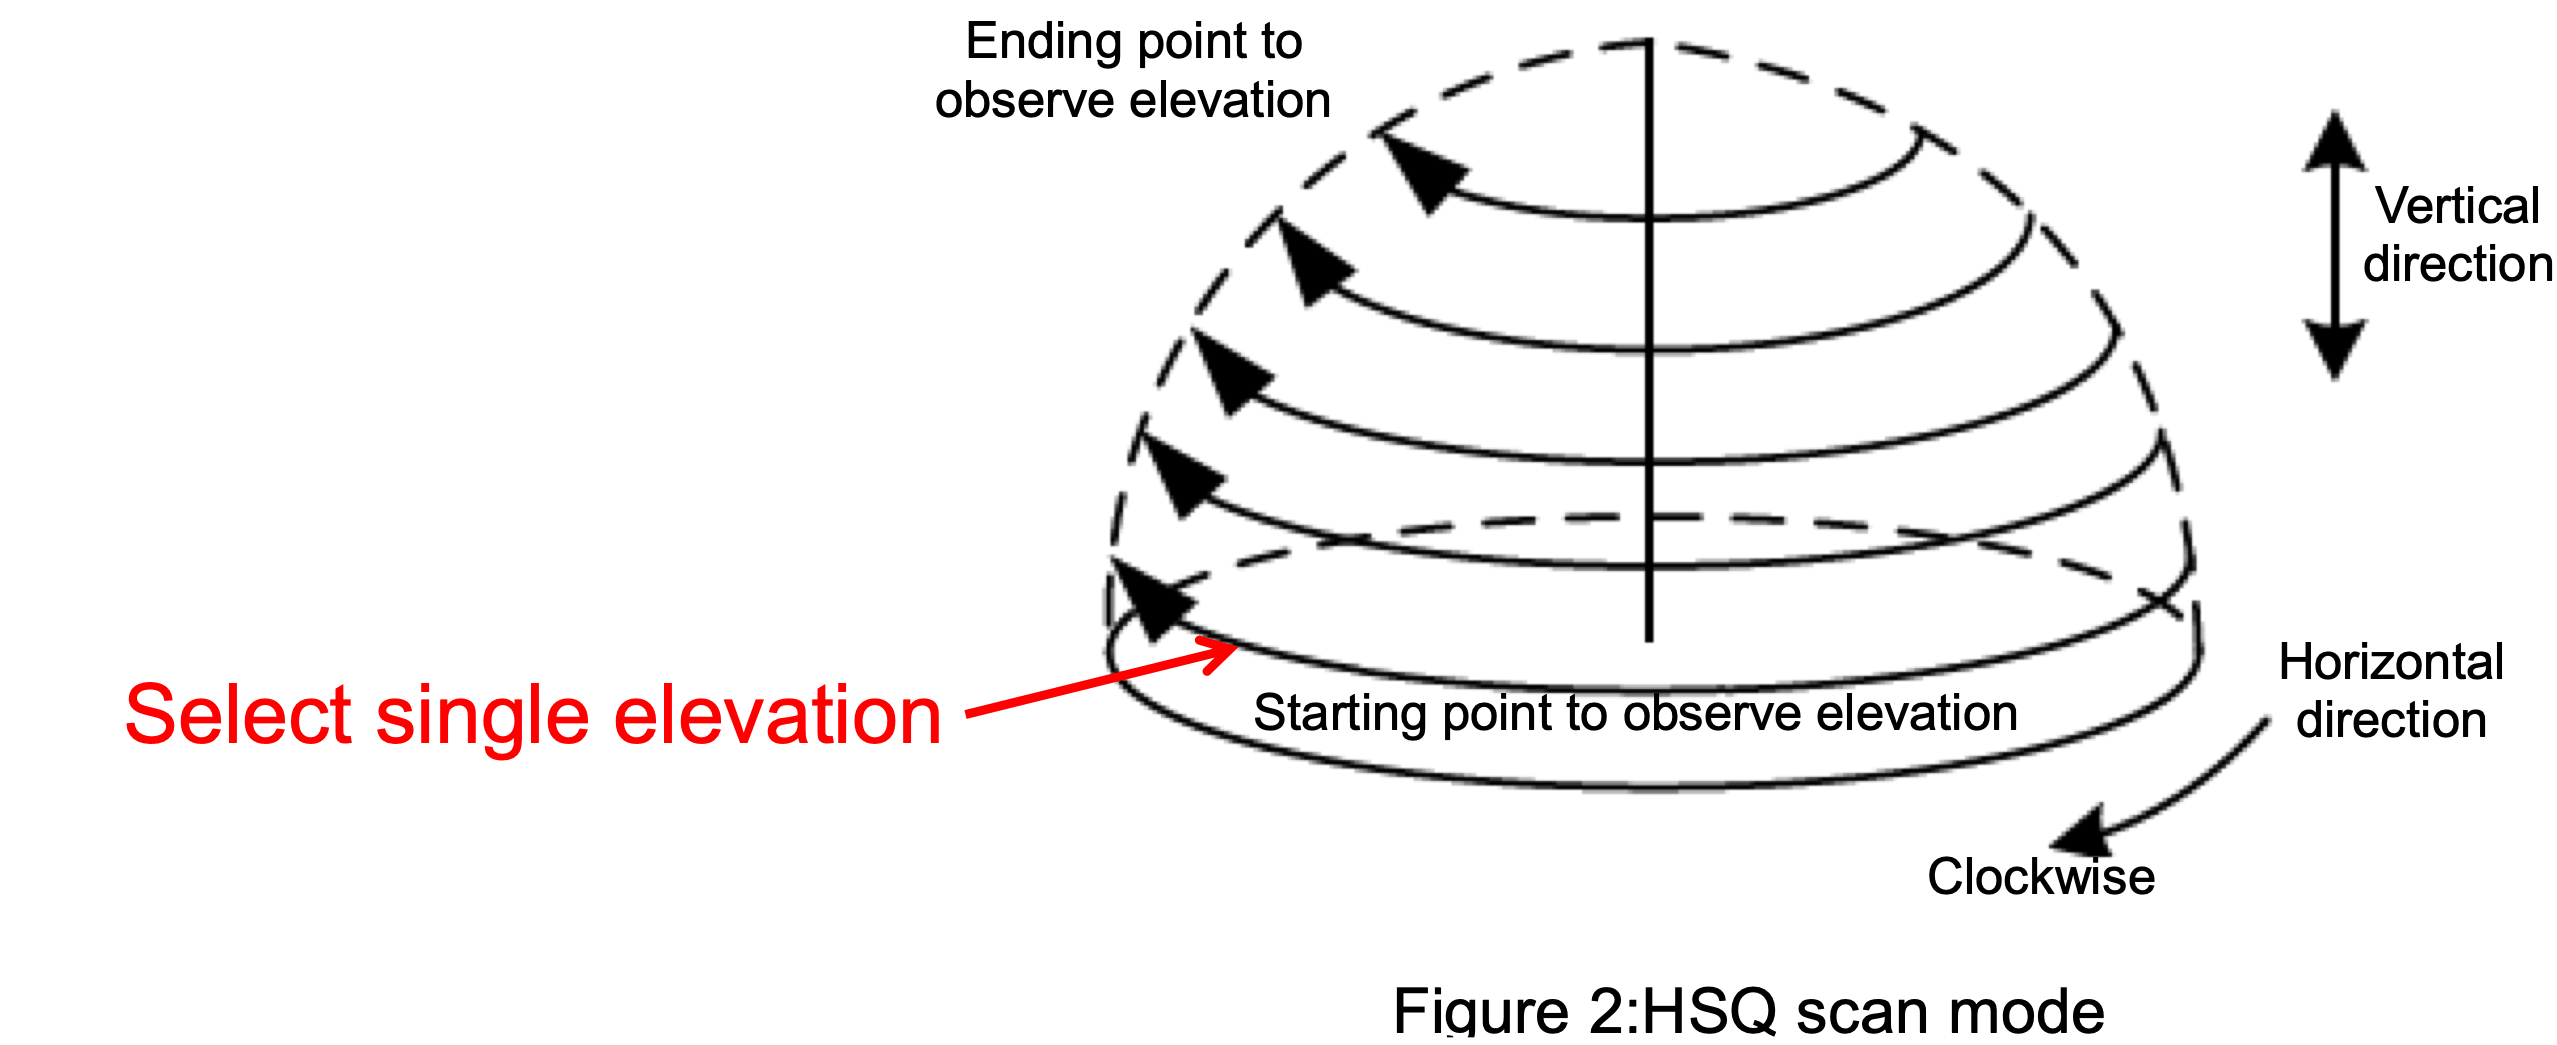
Volume scan (HSQ scan)
- Up to 32 elevation changes available
- Set observation time interval
- Ensure total scans, intervals, and return times are less than set time
PPI (Plan Position Indicator)
This scan makes a single, constant elevation, continuous azimuth scan. This scan is used for quick estimation.Example: Use lowest elevation scan, output data as a .jpeg file.
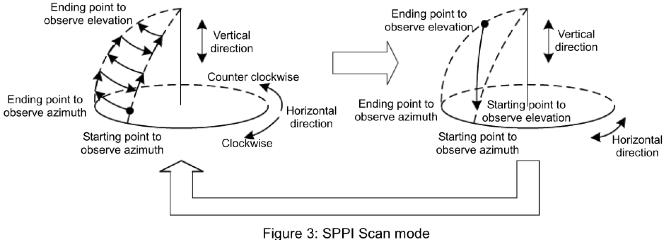
Sector PPI
Used to focus on a particular spatial (3D) area, and provides a faster observation updates.
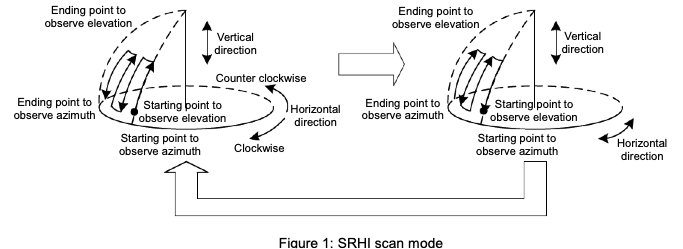
Sector RHI (Range Height Indicator)
Used for vertical structure focus and provides faster observation updates.
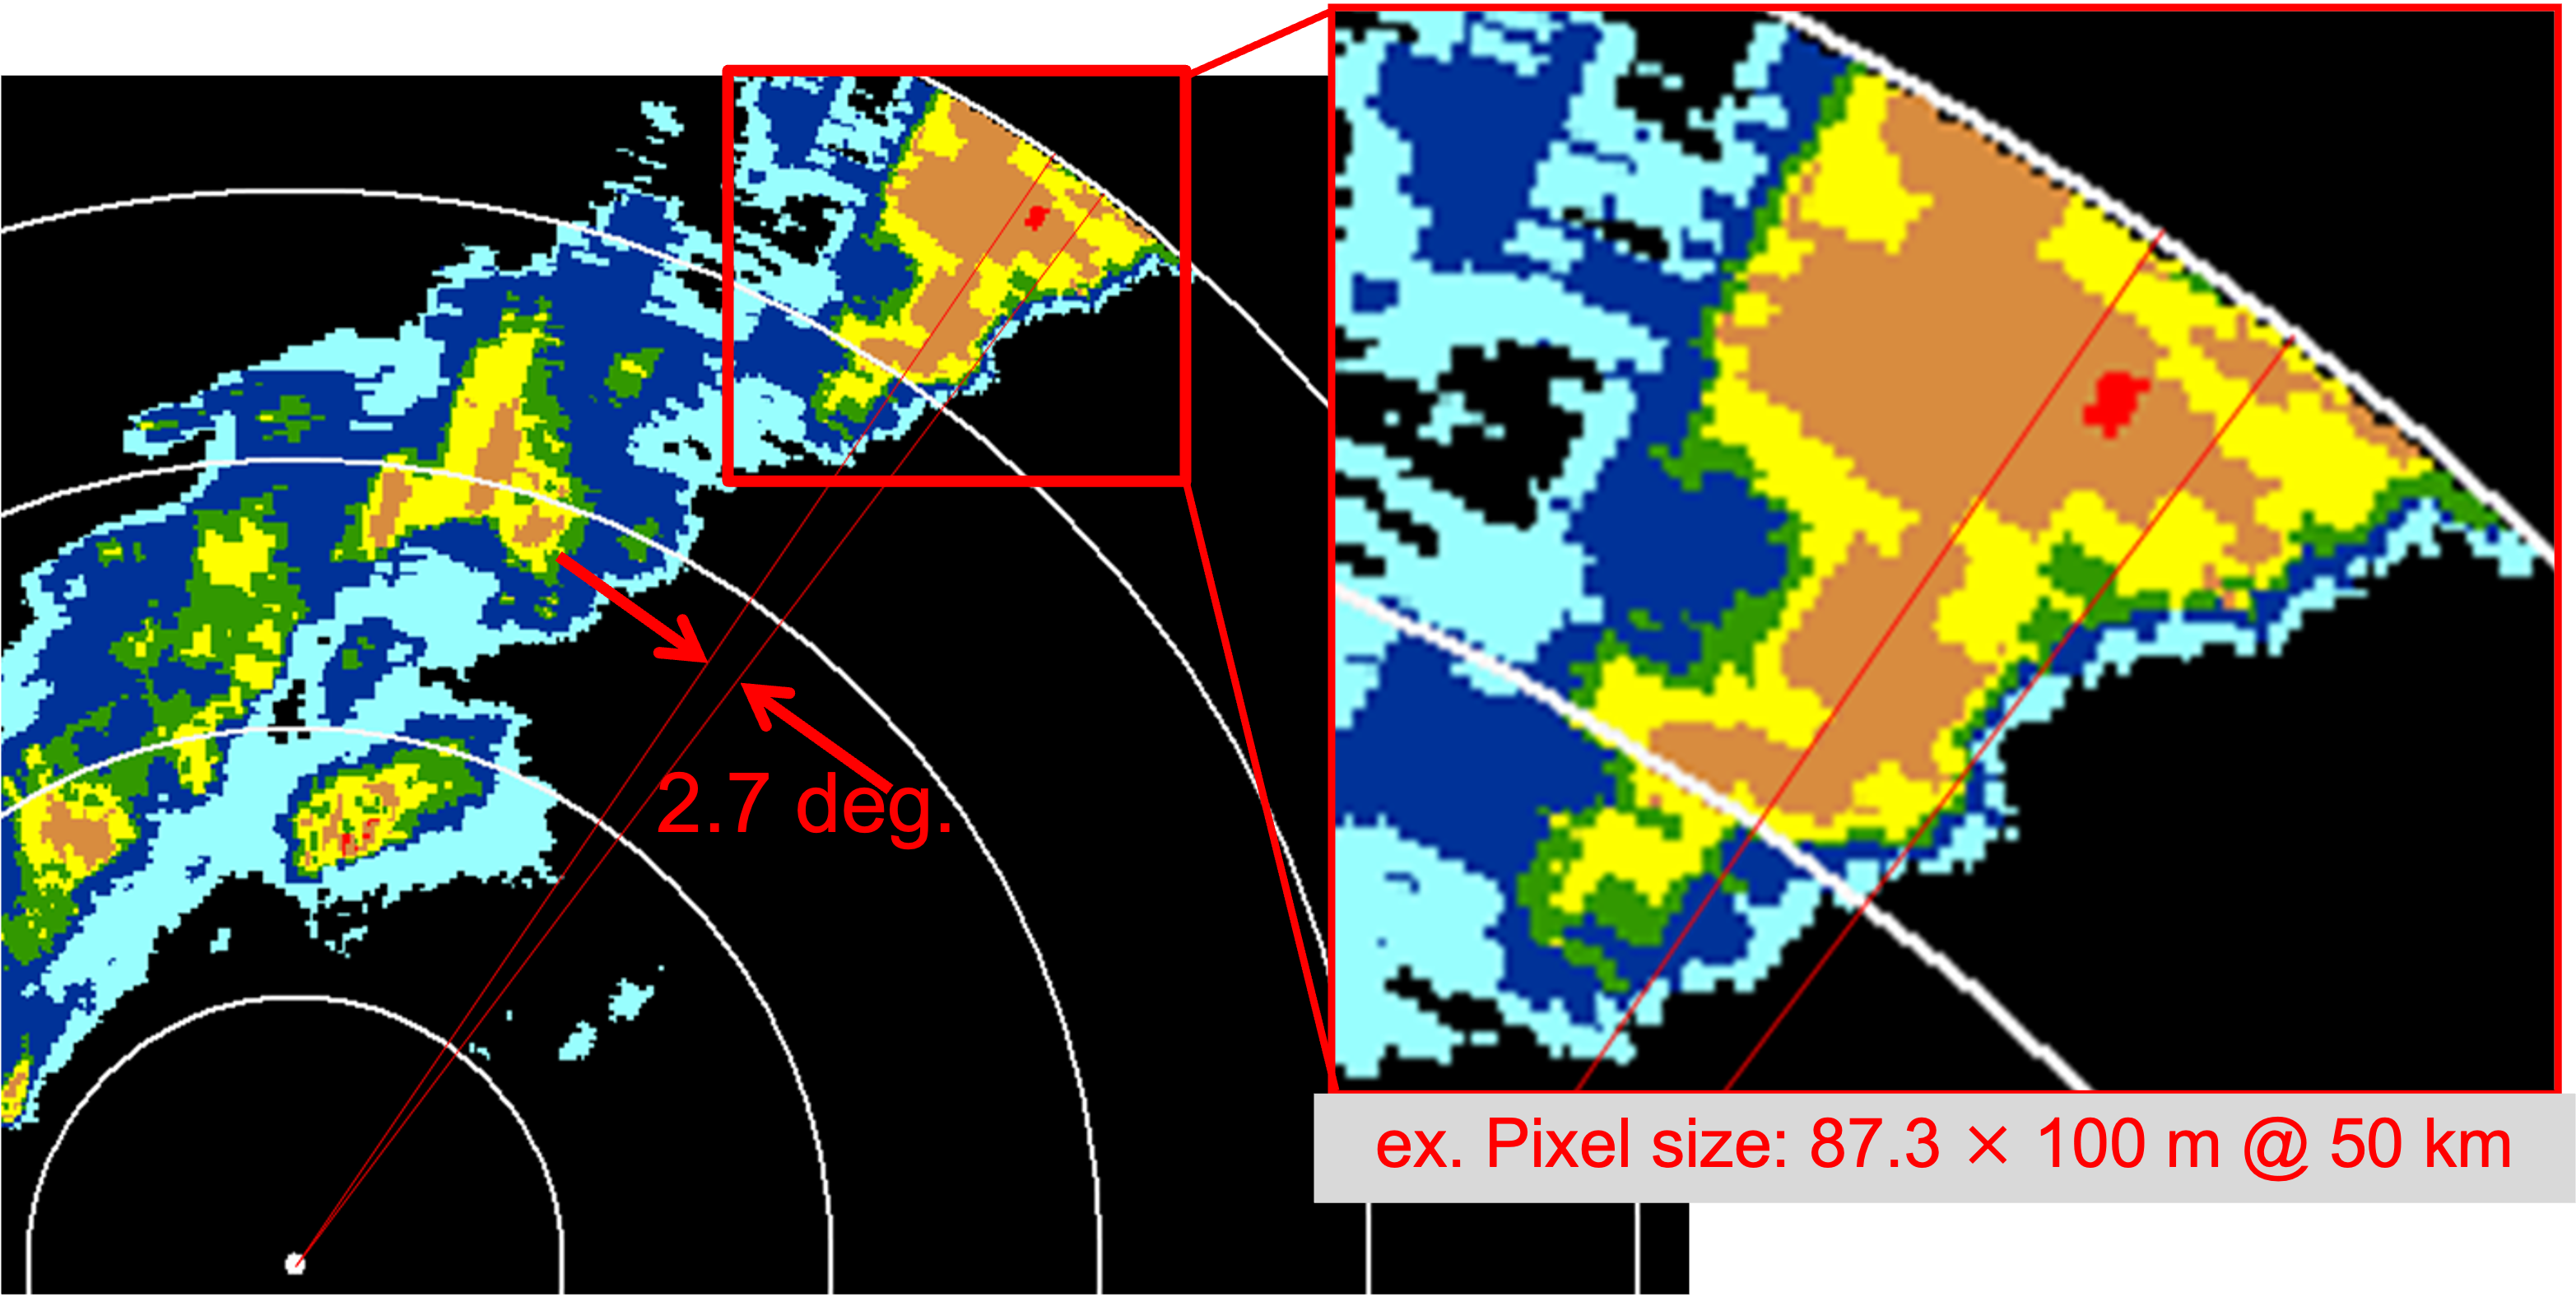
Spatial resolution
Spatial Resolution Example
This is a typical precipitation observed by the WR-2100 which uses similar specification antenna. 2.7 deg. antenna is used and the data step is 0.1 deg., with range resolution at 100m in this example.
Therefore the data pixel size at 50 km will be 87.3 m by 100 m.
The red line indicates 2.7 deg. width, you can see a difference inside of the enlarged beam width window.
The example shows how to use a practical azimuth resolution and which is better than antenna beam width.
Of course the resolution of 2.7 deg. antenna is wider than 1 deg. antenna, however it has high resolution, particularly for shorter range use.